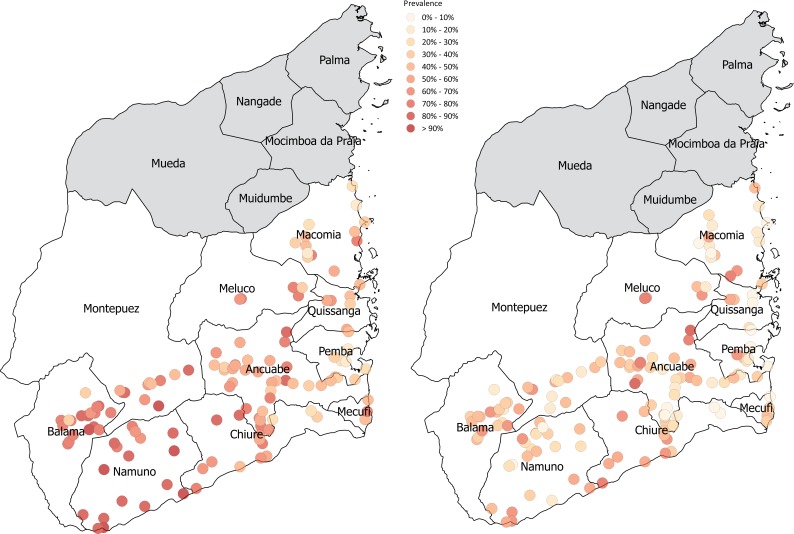
Fig 2. S. haematobium village-level prevalence across the ten survey districts in Cabo Delgado at baseline and Year 5.
The S. haematobium prevalence of each village has been colour coded on the map according to level of prevalence. At baseline there are a greater number of higher prevalence (coded dark red), particularly in those areas furthest from the coast. At Year 5, the prevalence levels of each village have been reduced (coded yellow and orange) across all districts and areas of the map. We created the map ourselves using QGIS and publicly available shapefiles from http://www.diva-gis.org/gdata" to the figure caption in the manuscript.

