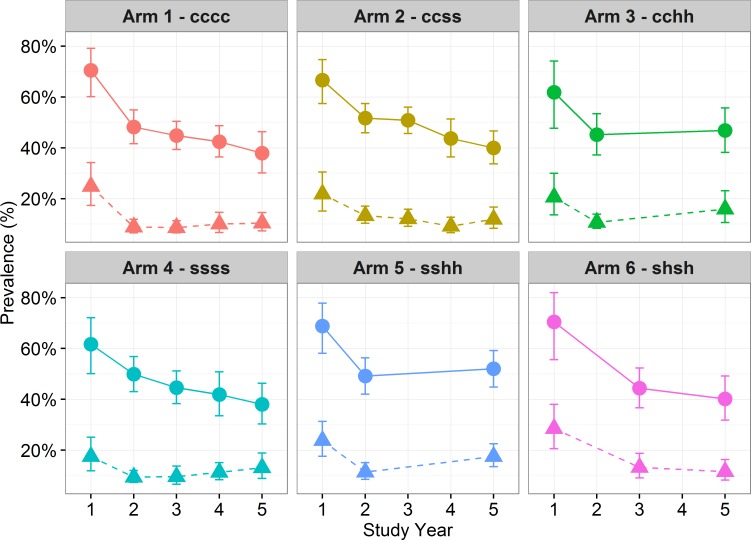
Fig 3. Prevalence of S. haematobium infection and heavy infection (dashed) by treatment over time (9–12 year-old-cross section only) and by study arm with 95% CI.
Each graph shows the change in prevalence of S. haematobium infection at each time point from baseline to Year 5 by study arm, with heavy intensity of infection also marked on the graph. Prevalence and heavy infection levels decrease over time in all arms, with the exception of arm 3 and 5 following two consecutive holiday years where infection levels appear to increase where communities were not treated for a two year period.

