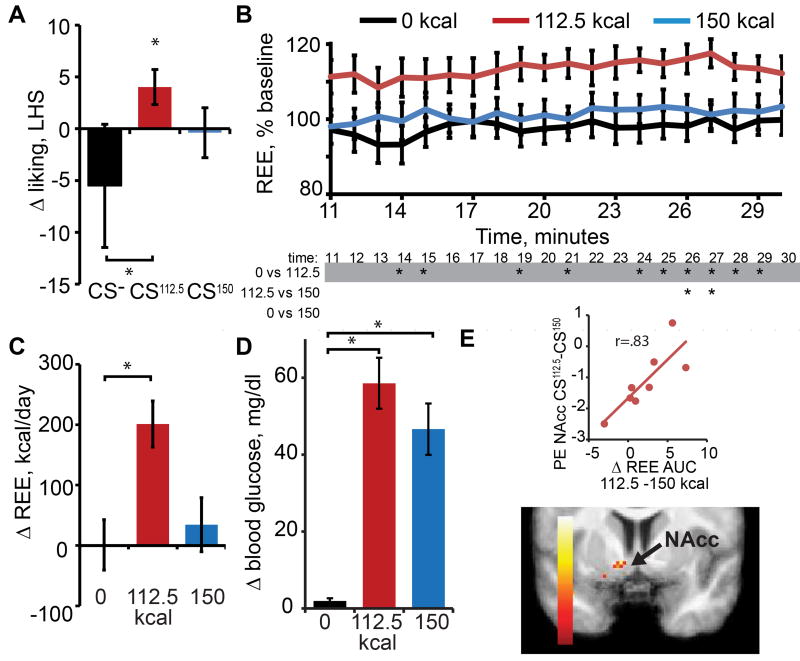
Figure 5. Experiment 3.
A) Change in liking (y – axis) pre vs. post-conditioning for each beverage (x-axis). Replicating study 1, planned comparisons reveal an increase in liking for CS112.5, but not CS150 (p = .03 and p = .83). (B) Change in REE across time (as in Figure 4B) depicting the main effect of beverage (F=5.994, p=0.011), with post-hoc t-tests showing change in REE greater following consumption of the 112.5kcal beverage relative to the 0kcal beverage at each time point and relative to the 150kcal at four timepoints. (C) The average change in REE as described in Figure 4A. Replicating study 2, there is greater change following the 112.5-kcal compared to the 0-kcal and 150-kcal beverages. (D) Change in blood glucose (y-axis) after consumption of each beverage (x-axis) depicting the effect of beverage, with greater change after 150- and 112.5-kcal beverages versus the non-caloric beverage. (E) Brain section shows significant clusters (corrected for multiple comparisons) of voxels. See also Table S3.

