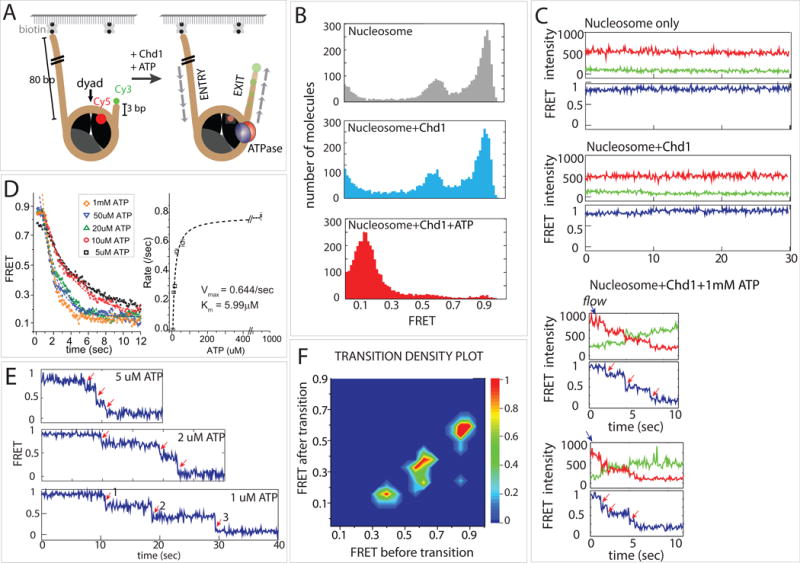
Figure 1. Chd1 repositions the nucleosome in a stepwise manner.

(A) Nucleosome-FRET construct was labeled with Cy3 on exit side DNA and Cy5 on histone H2A(T120C). Only the proximal Cy5 dye is shown.
(B) Histograms of FRET values before and after addition of Chd1. FRET histograms of nucleosomes alone displayed a bimodal distribution, correlating with nucleosomes having labeled H2A in a proximal (high FRET) or distal (mid-FRET) position (gray, top). Addition of Chd1 without nucleotide (light blue, middle) did not show significant differences from nucleosome alone. After addition of ATP (red, bottom), FRET histograms were dominated by a single, low FRET peak.
(C) Representative single molecule FRET traces for each condition in (B).
(D) Averaged FRET traces at varying ATP concentrations and the corresponding Michaelis-Menten fit.
(E) Single molecule traces at low ATP, which display stepwise decreases in FRET.
(F) Transition density plot showing three steps of discrete FRET transitions.
