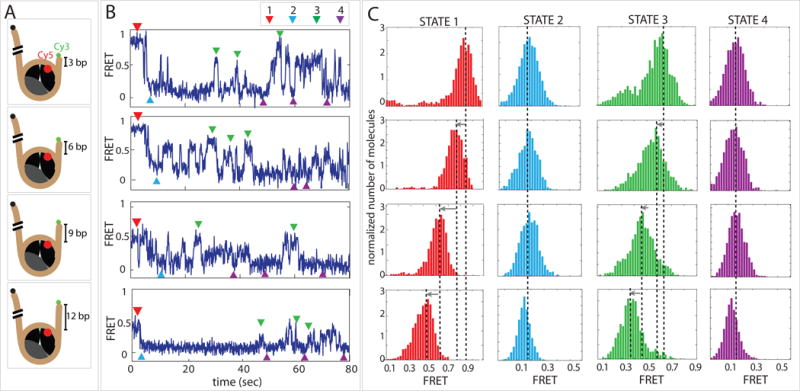
Figure 4. For the direction of nucleosome sliding by Chd1, DNA sequence can dominate over the length of flanking DNA.

(A) Schematic diagrams of four FRET labeled nucleosome constructs with varying lengths of flanking DNA.
(B) Representative single molecule FRET traces obtained for each nucleosome construct.
(C) FRET histograms of four distinct states: starting nucleosome position (STATE 1, red), short DNA end shifted away from nucleosome (STATE 2, light blue), short DNA end pulled back toward nucleosome (STATE 3, green) and repetitive low FRET state where DNA is more distant from nucleosome (STATE 4, purple).
