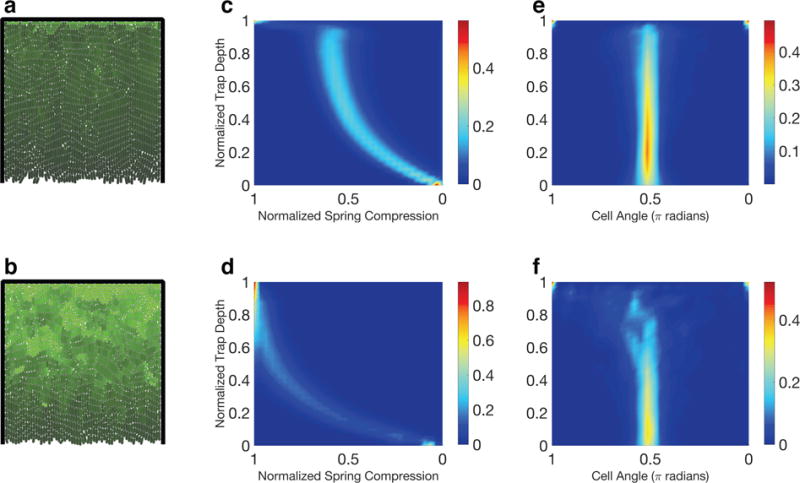
Figure 4. Emergent dynamics as a function of rest length extension rate versus spring compression profile.

Single-strain collective growing in a three-walled trap. Rest length extension rate is constant when spring compression is small, but decreases linearly after compression crosses a threshold. First row: high threshold; second row: low threshold. (ab) Concentration of a constitutively-produced protein (brighter color indicates greater concentration.) Protein concentration is highest in the back of the trap because typical cell division time is longest there. Lowering the compression threshold leads to a significant increase in protein accumulation. (cd) Distribution of normalized compression over the lifespans of the simulations. Each horizontal slice represents the empirical probability density function for compression at a given trap depth. (ef) As in (cd), but for cell angle instead of compression. Notice that nematic disorder in the back half of the trap is greater with lower compression threshold. Trap dimensions: 65 μm × 65 μm.
