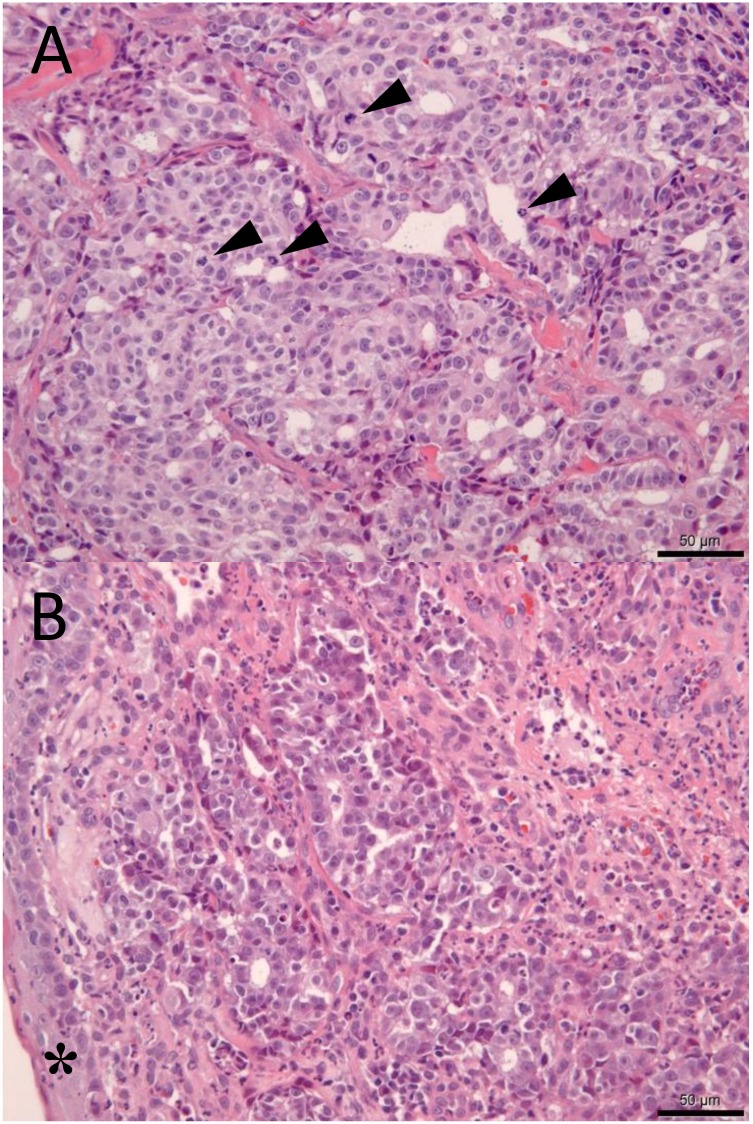
Fig. 3.
Histopathological examination of the mass around the left ear canal (3A) and laryngeal lesion (3B). 3A, higher magnification image of the mass around the left ear canal (hematoxylin and eosin [H&E] stain, ×400). Mitotic counts (arrowheads) are in the range of 3–9/high-power field (bar=50 µm). 3B, higher magnification image of the laryngeal lesion (H&E stain, ×400). Tubular proliferation of tumor cells is observed beneath the mucosa (*), and these cells are identical to the cells obtained from the mass around the ear canal (bar=50 µm).

