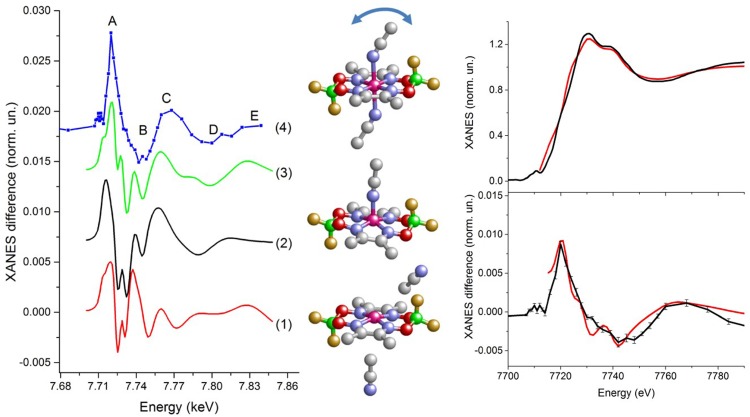
FIG. 17.
Left panel: Transient X-ray absorption spectra corresponding to the transition from the Co(II) to Co(I) state. Calculations for different models of Co(I) state: 5-coordinated model [red curve (1)], 4-coordinated model [black curve (2)] and 6-coordinated model with moderate out-of-plane displacement of Co and disordered solvent molecule [green curve (3)] are compared with the experimental data for the multicomponent photocatalytic system with the Co(dmgBF2)2 catalyst (blue curve 4). Central panel: Structural models used for the calculations. Grey atoms are C, Blue: N, Green: B, Yellow: F, Red: O, and Magenta: Co. H atoms are omitted for clarity. Right panel: Comparison of the experimental Co K-edge XANES spectra of cobaloxime in acetonitrile (black line on the top) with the theoretical simulation for the best-fit structure (red line on the top). Calculated transient XANES data for the best-fit model (red line, bottom) are compared with the experimental data (black line, bottom). Adapted with permission from Smolentsev et al., Faraday Discuss. 171, 259 (2014). Copyright 2014 The Royal Society of Chemistry, licensed under CC BY 3.021 and adapted with permission from G. Smolentsev and V. Sundstrom, Coord. Chem. Rev. 304–305, 117 (2015). Copyright 2015 Elsevier.223

