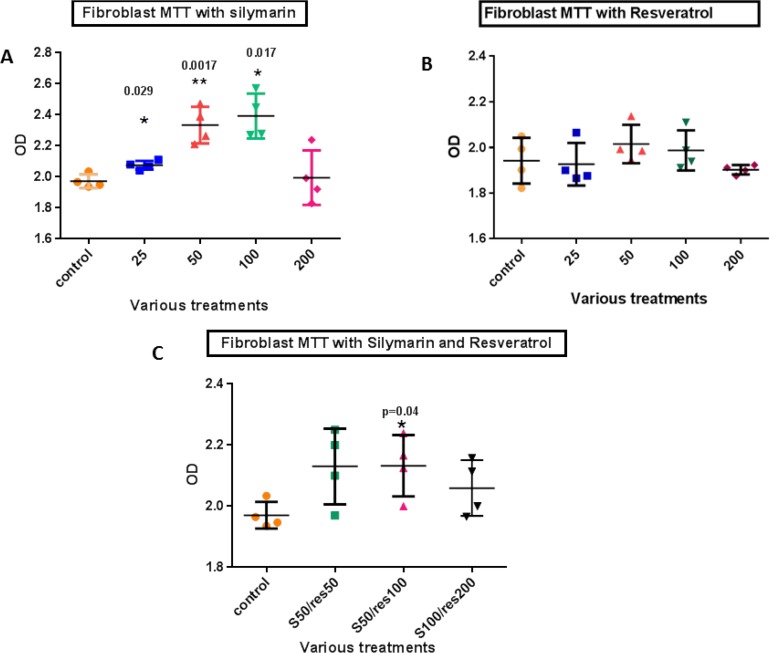
Fig. 1:
Cell viability of HGFs after various treatment with (A) silymarin, (B) resveratrol and (C) their combinations (50μg/ml silymarin with 50μg/ml resveratrol, 50μg/ml silymarin with 100μg/ml resveratrol, and 100μg/ml silymarin with 200μg/ml resveratrol) compared with the controls. res=resveratrol, S=Silymarin. Data are presented as mean±SD of the three separate experiments, analyzed by GraphPad Prism software program via ANOVA and Student’s t-test. * indicates p<0.01

