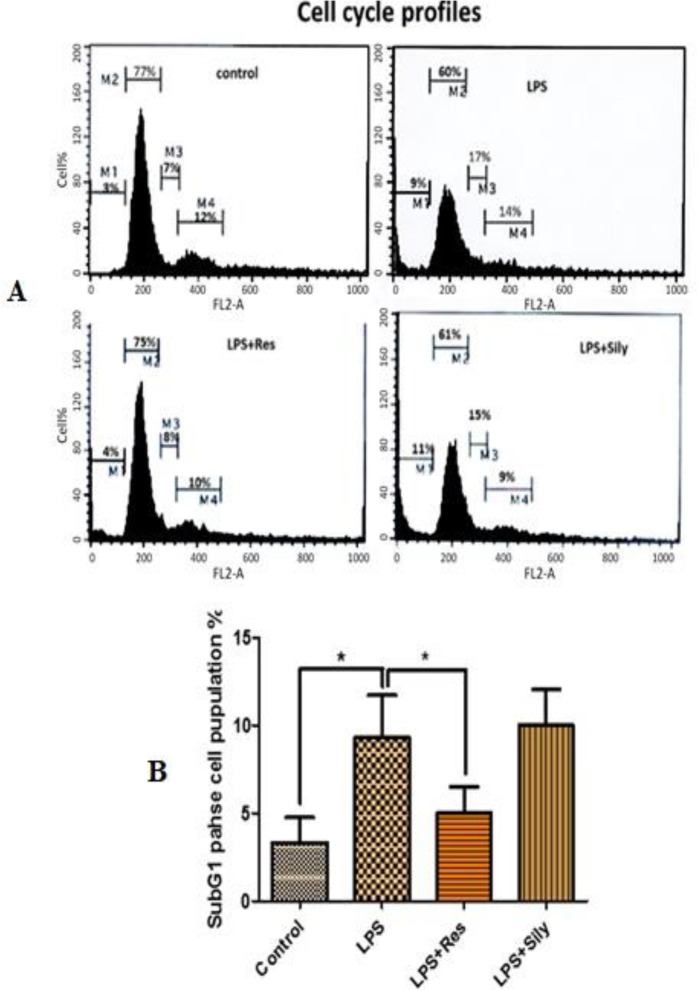
Fig. 2:
Effects of silymarin and resveratrol on the cell cycle of LPS-induced cells. (A) Representative histograms of the cell cycle after treatments with 100μg/ml resveratrol and/or silymarin, (B) The diagram shows the variation of the cell population in the sub-G1 phase (degree of apoptotic and dead cells) after various treatments. Data are presented as mean±SD of the three independent flow cytometry experiments, measured by CellQuest Pro Analysis software program and analyzed by GraphPad Prism software program via ANOVA and Student’s t-test. LPS=lipopolysaccharide, LPS+res= lipopolysaccharide+resveratrol, LPS+sily= lipopolysaccharide+Silymarin. * indicates p<0.01

