
Figure 2.
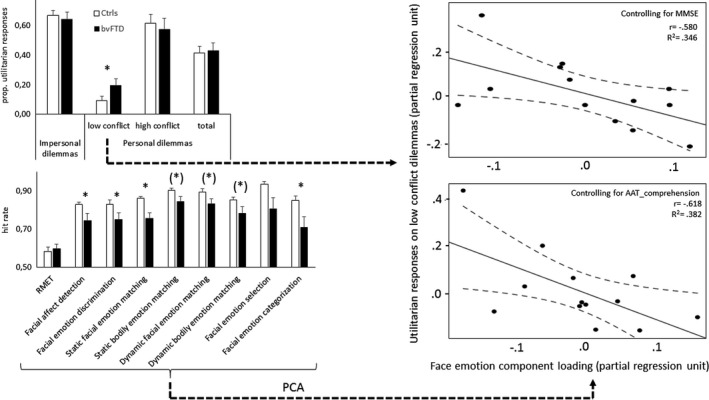
Behavioral results and schematic analysis procedure. The bar charts on the left display performance on the moral judgment (top) and emotion processing (bottom) experiments. The scatterplots on the right display the partial correlation between utilitarian responses on low‐conflict dilemmas (Y‐axis) and loading on the face emotion component derived from the emotion processing experiments (X‐axis), controlling for MMSE‐score (top scatter plot) and AAT_comprehension‐score (bottom). The scatterplots include the linear fitted line (full line) and 95% confidence interval of the mean. RMET, adapted Reading the Mind in the Eyes Test; PCA, Principal Component Analysis; *p < .05; (*)p < .059