
Figure 2.
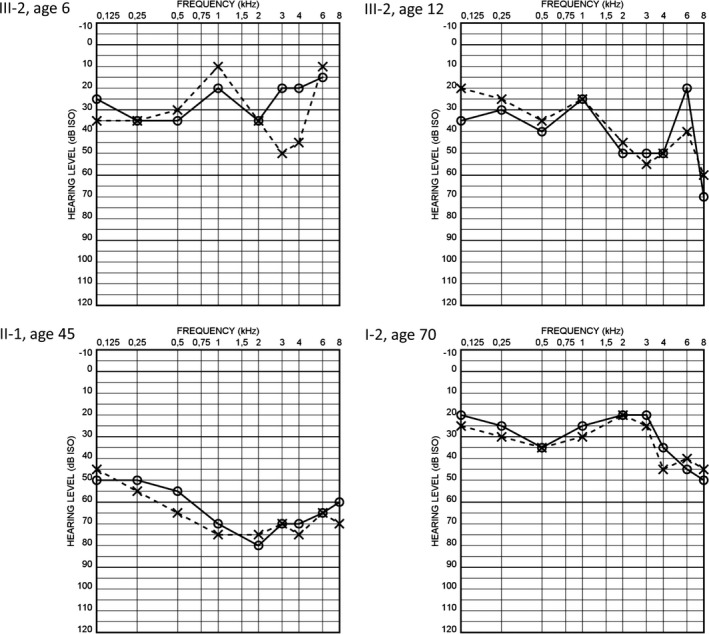
Audiograms of the family members harboring the m.7510T>C mutation. Audiograms represent pure tone hearing thresholds of right (O) and left (X) ear at all measured frequencies (kHz). III‐2, proband; II‐1, mother of the proband; I‐2, grandmother of the proband