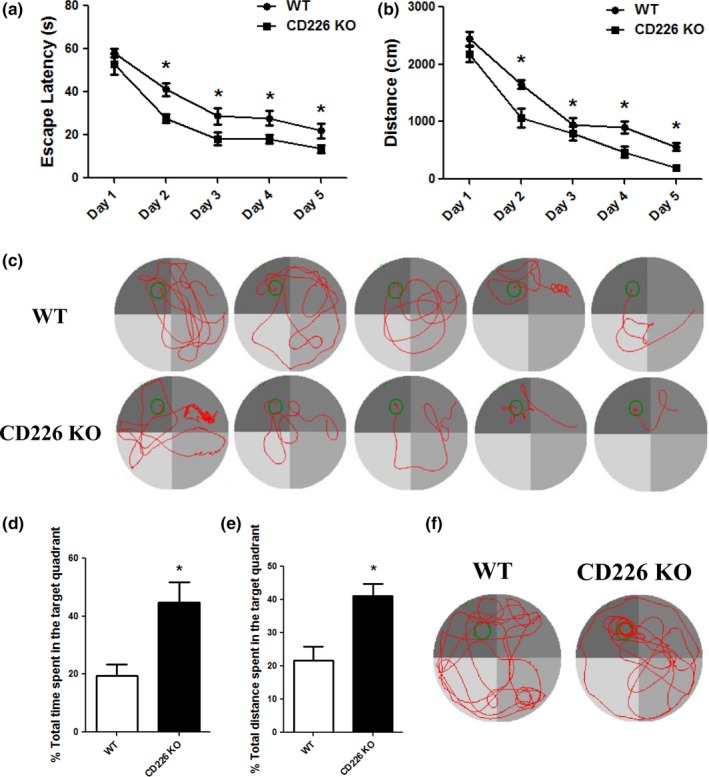
Figure 1.

CD226 deficiency enhanced spatial learning and memory in mice in Morris water maze test. (a and b) Graph showing the average escape latencies and distances of mice in searching for the hidden platform during five consecutive training days. (n = 10, *p < .05 compared with WT control). (c) Representative swimming traces of mice in two groups during the hidden platform test. The large circle represents the water maze pool and the small circle represents the platform. (d and e) Histograms showing the increase in swimming time and distance in the target quadrant during probe trial test. (n = 10, *p < .05 compared with WT control). (f) Representative swimming traces during the probe test
