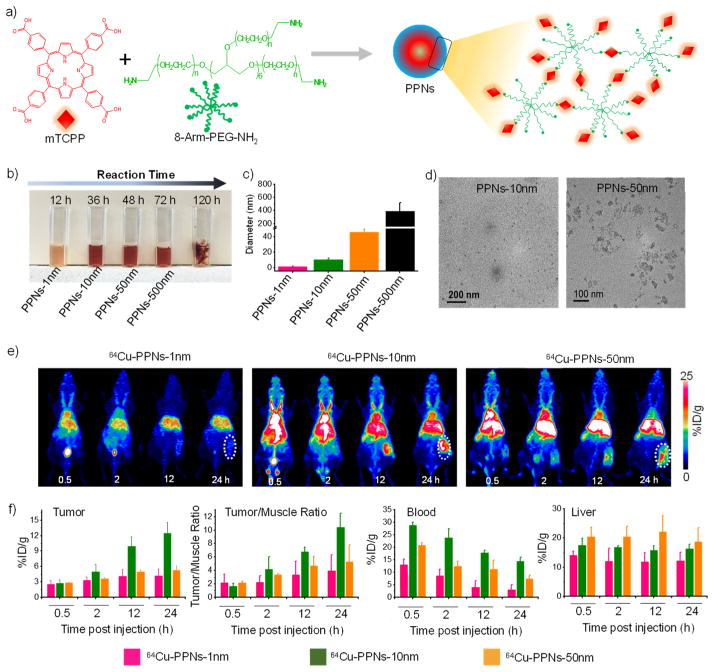
Figure 1.
a) A synthetic scheme of the mTCPP-aPEG nanocomplexes (PPNs). b) Photo and c) DLS diameter of obtained PPNs. d) TEM images of PPNs of approximately 10 nm (left) and 50 nm (right). e) Maximum intensity projections of PET imaging of tumor-bearing mice after injection of 64Cu-PPNs. f) Quantitative biodistribution obtained from ROI analysis of PET images.

