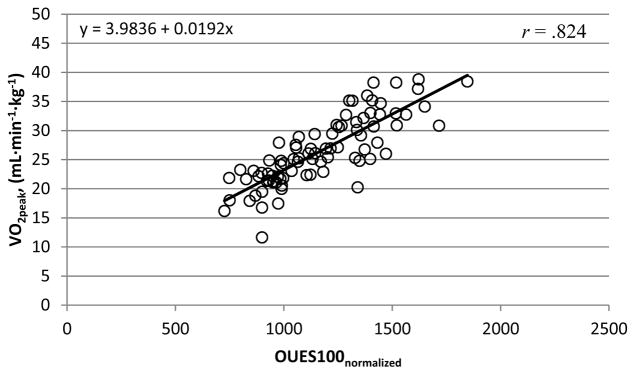
Figure 3. OUES100normalized and V̇O2peak (mL·min−1·kg−1).
The linear relationship between OUES100normalized and V̇O2peak (mL·min−1·kg−1) for participants who satisfied criteria (n=85). These data were used to obtain the OUES100normalized prediction equation (V̇O2peak = 3.98 + .019 * OUES100normalized) which is represented by the solid linear slope.

