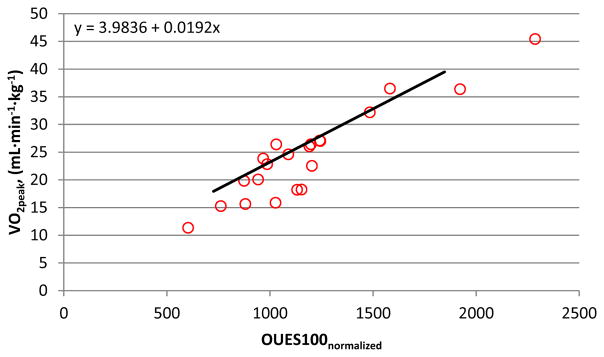
Figure 4. OUES100normalized and V̇O2peak (mL·min−1·kg−1).
The linear relationship between OUES100normalized and V̇O2peak (mL·min−1·kg−1) for participants that did not satisfy criteria (n=21) with the solid linear slope (same as Figure 3) estimated from participants who satisfied criteria (n=85). Figure 4 demonstrates that data points for participants who did not satisfy criteria are located on the right of the solid slope, indicating an underestimation of their V̇O2peak. On average, these participants had a mean V̇O2peak underestimation of 2.31 mL·min−1·kg−1 (Table 3).

