Figure 4.

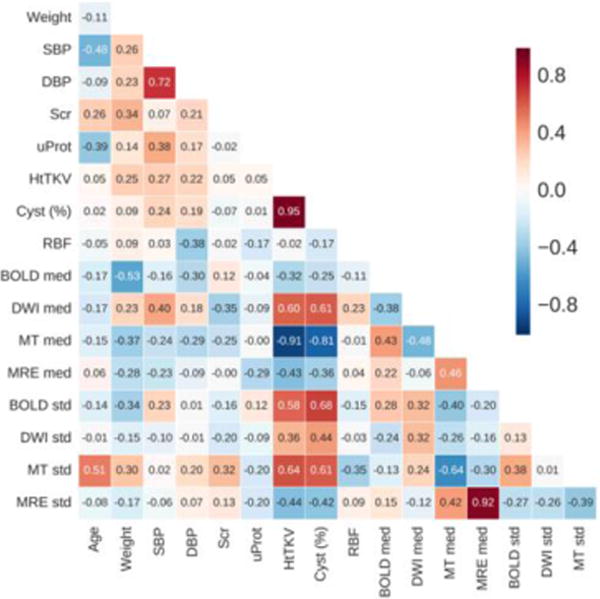
Correlation matrix comparing the main biomarkers considered in this study. Shown here are the relationships for the entire cohort. For the quantitative techniques both the median (med) and standard deviation (SD) for NCRP are presented.

Correlation matrix comparing the main biomarkers considered in this study. Shown here are the relationships for the entire cohort. For the quantitative techniques both the median (med) and standard deviation (SD) for NCRP are presented.