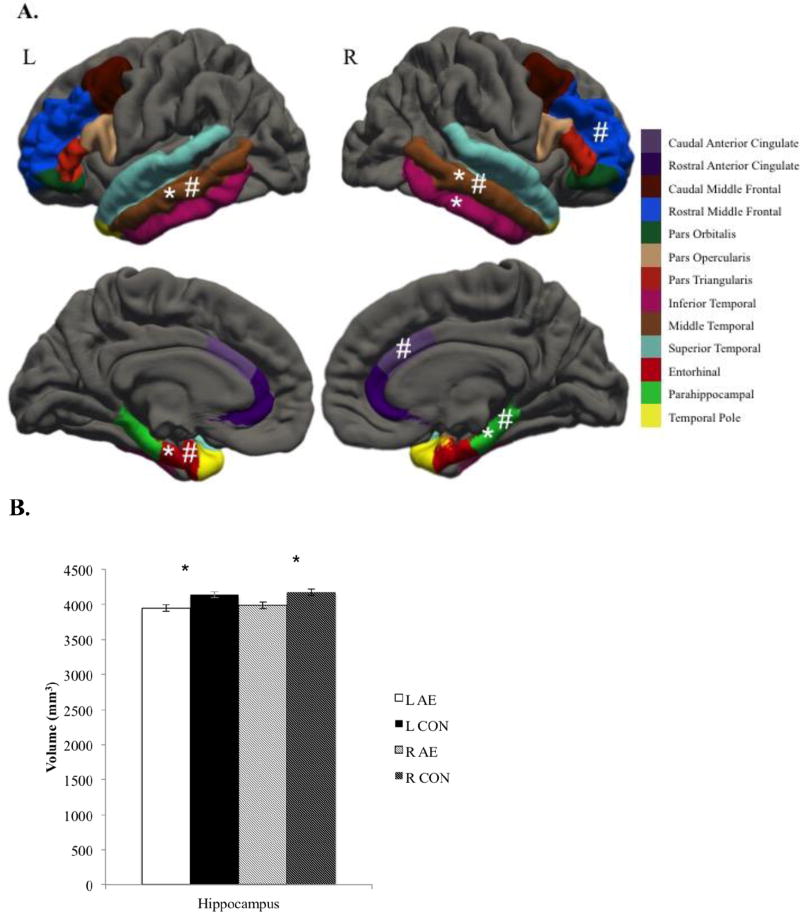
Figure 1.
Group differences in volume, thickness, and surface area for regions of interest.
A) Group differences in cortical regions of interest.
L, Left; R, Right; AE, Alcohol-Exposed; CON, Control
* denotes significant group difference in volume, # denotes significant group difference in surface area. In all cases, AE < CON. There were no significant group differences in thickness.
B) Group differences in hippocampal volume.
* denotes significant group differences.

