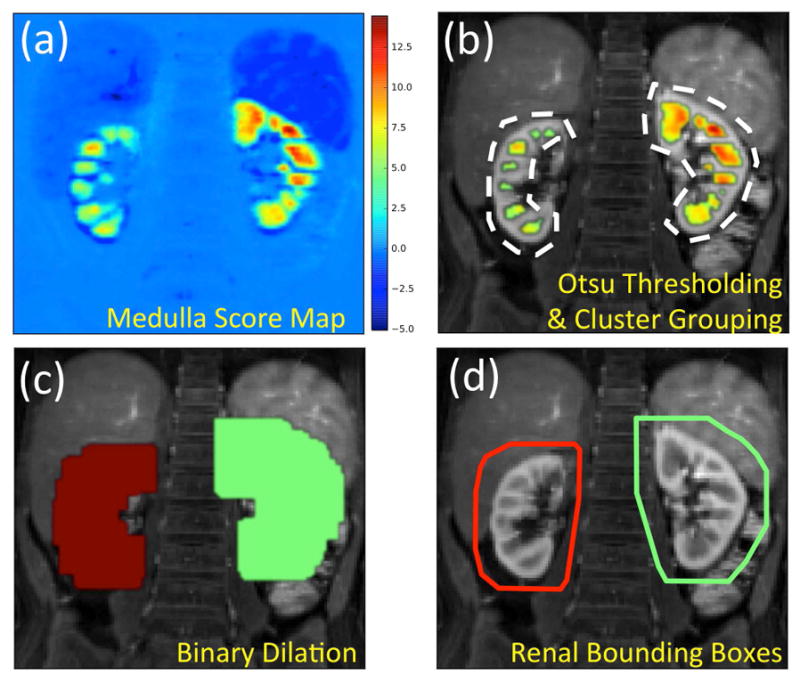
FIG. 3.

Detection of renal bounding boxes. (a) Distribution of medulla scores in the abdominal image. The scores are whitened by removing the mean and normalizing the standard deviation. The values are the number of standard deviations from the mean score. (b) Scores above the Otsu threshold overlaid on the anatomical image. Clusters within a maximum cortical thickness distance from each other grouped together under the same color. (c) Medulla groups are dilated by the maximum cortical thickness to cover the renal parenchyma. (d) 3D convex hulls of the dilated medulla groups are calculated to create renal bounding boxes.
