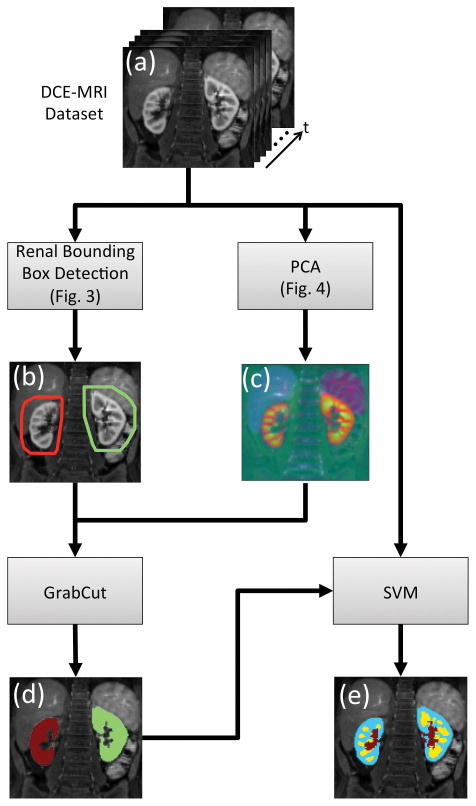
FIG. 5.
Flowchart of the automated segmentation process. (a) Input to the algorithm is the time resolved 3D DCE-MRI dataset. (b) Renal bounding box calculated using the steps described in Fig 3. (c) PCA is applied to the DCE-MRI dataset along the time axis to reduce it to 3 channels represented as RGB. The resulting image has no temporal phases however it still has temporal information (i.e. different colors map to different signal-time curves). (d) Output of the renal parenchyma segmentation using GrabCut. (e) Output of the voxel level SVM classifier for segmentation of renal cortex (blue), medulla (yellow) and the collecting system (red).

