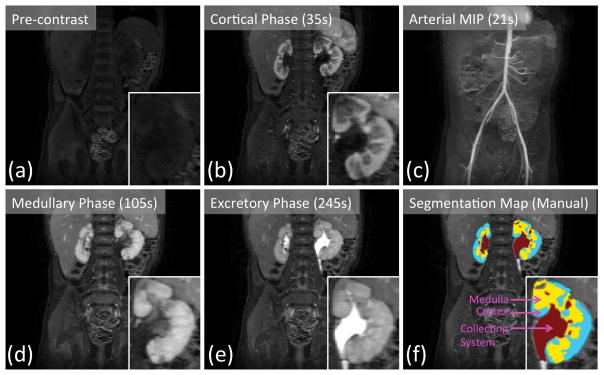
FIG. 6.
Renal pre-contrast (a) and post-contrast (b, d, e) phases captured by 7s temporal resolution VDRAD acquisition. (c) The arterial phase can be observed in the maximum intensity projection (MIP) image. Manually drawn segmentation map (f) is used as the ground truth labeling of the renal voxels.

