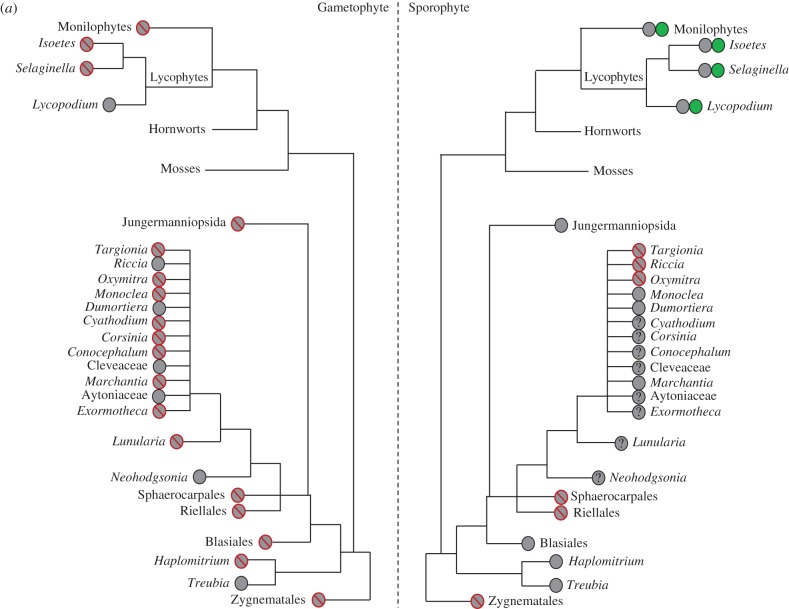
Figure 7.
Simplified phylograms illustrating the distribution of intercellular spaces and stomata in the major lineages at the base of the land plant tree of life: (a) liverworts (gametophyte and sporophyte generations); (b) mosses (sporophyte only); (c) hornworts (gametophyte and sporophyte generations). This underlines the likely multiple evolution of both features.  Stomata present,
  Stomata absent,
  Stomata +/−,
  ICSs present,
  ICSs absent,
  ICSs presence/absence not known.


