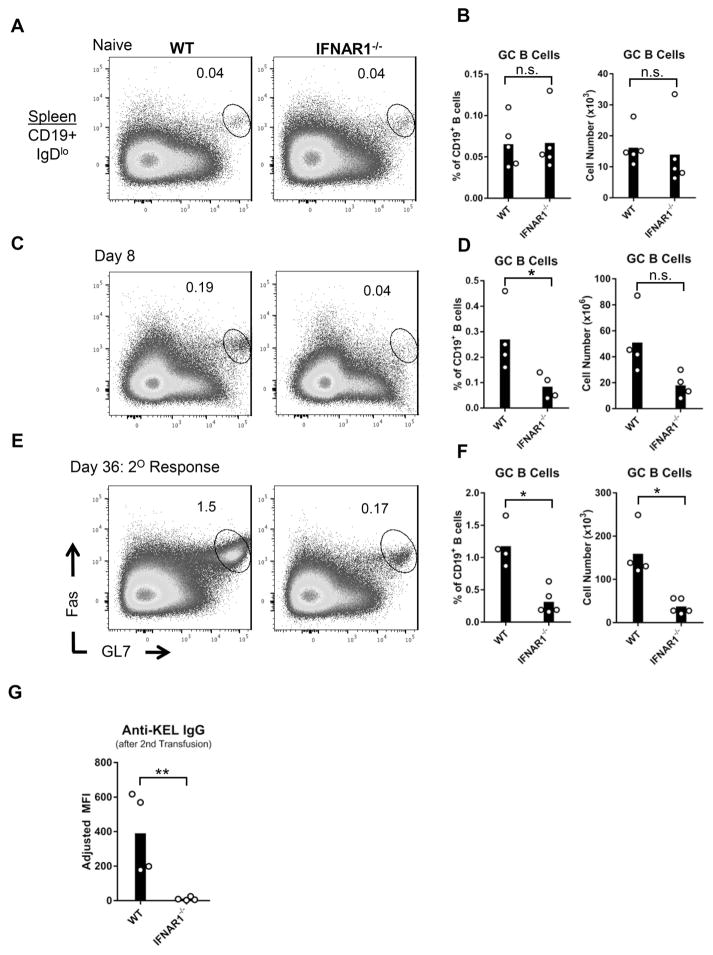
Figure 5. IFNα/β promotes germinal center B cell development.
IFNAR1−/− and WT mice were transfused with KEL RBCs. (A, C, E) Representative flow cytometric analysis of spleen GC B cells (CD19+IgDloFas+GL7hi) from (A) naïve or transfused mice (C) 8 or (E) 36 days after transfusion. Plots are gated on live CD19+IgDlo cells. Numbers on plots indicate the percent of CD19+ B cells within the drawn region. (B, D, F) GC B cells quantified as percent of CD19+ B cells (left) and cell number (right). (G) Serum anti-KEL IgG measured by flow cytometric cross-match 36 days after transfusion. (E–G) Mice received a second transfusion 28 days following the first transfusion. Data are from one of two independent experiments with 3–5 mice per group. *p<0.05, **p<0.01, n.s., not significant, by Mann Whitney U test. Data from a repeated independent experiment are shown in Supplemental Figure 3.

