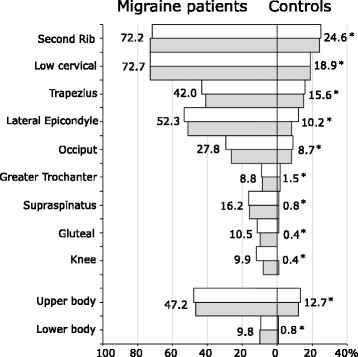
Fig. 2.

The percentage of migraine patients (left bars) and controls (right bars) with positive tender point sites examined, arranged in sequence from highest to lowest for controls. White bars and gray and bars indicate right and left, respectively. * p < 0.001, χ2 test
