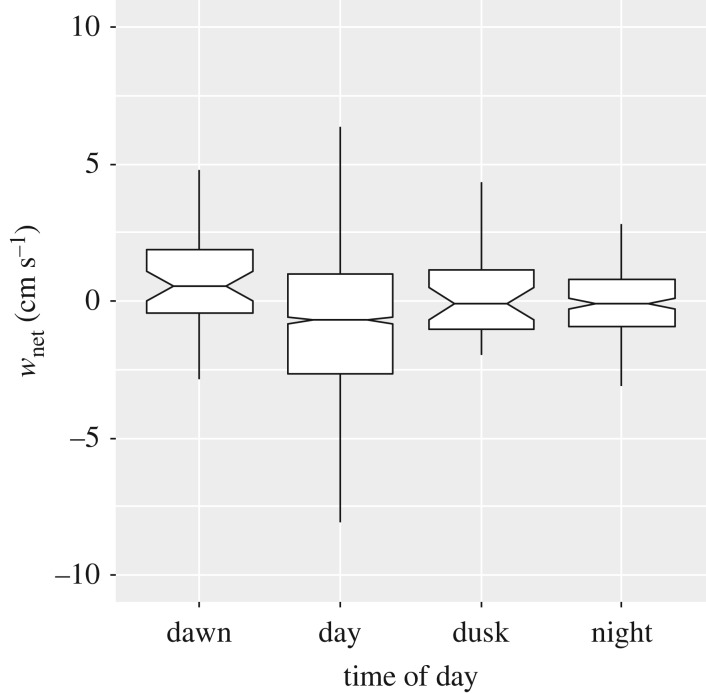
Figure 3.
Downward vertical velocity anomaly (wnet) at different phases of the diel cycle. A positive value for wnet represents an upward anomaly, a negative value a downward anomaly. Notched horizontal line represents the median, limits of boxes the 25th and 75th percentiles, and vertical lines 1.5 times the interquartile range.

