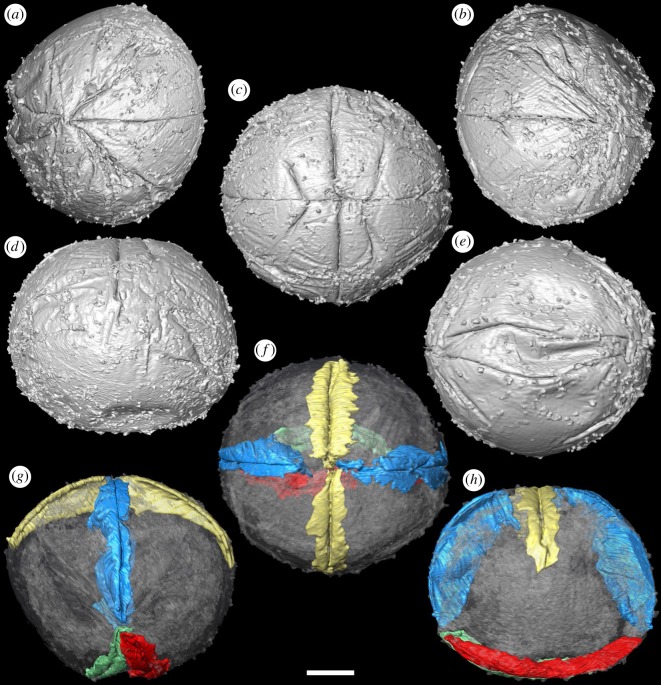
Figure 1.
Tomographic surface models of Pseudooides specimens preserving the initial stages of delineation of the ‘germ band’ (GMPKU3100). (a–e) SRXTM surface renderings. (a) Left, (b) central and (c) right views of the ‘germ band’; (d) lateral view, with ‘germ band’ top and centre; (e) opposing pole of the specimen. (f–h) SRXTM rendering of the longitudinal furrow (blue), transverse furrow (gold) and the basal folds (green, red): (f) central view of the ‘germ band’; (g) lateral view of the longitudinal furrow, (h) lateral view of the transverse furrow. Scale bar, (a–h) 52.5 µm. (Online version in colour.)

