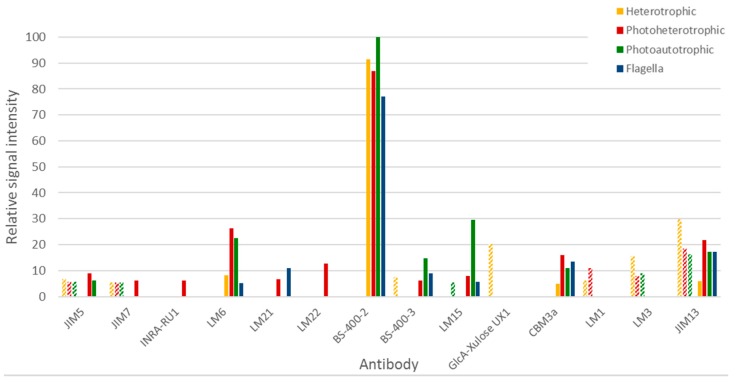
Figure 4.
Immunocarbohydrate microarray profiling of Euglena samples. Only those antibodies that had some reactivity to the Euglena samples are presented and a full list of the antibodies used and their specificity are presented in Table S3, Supplementary Materials. Hashed bars represent CDTA released material and solid bars represent NaOH released material. Signal is normalised to the strongest signal.

