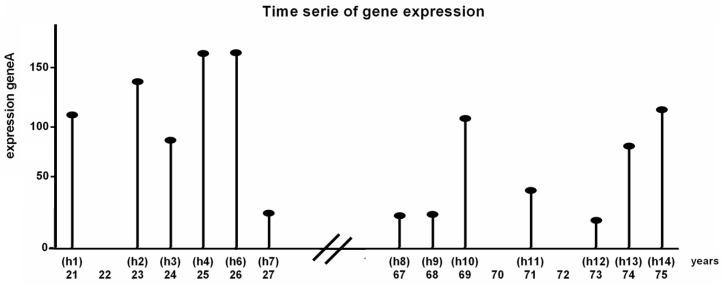
Figure 4.
Schematic representation of one gene in the gene expression data (NCBI GEO ID GSE362). In the experiments muscle samples from 15 healthy humans of different age (21–75) were taken. The samples were arranged in ascending order by age to form a time-series. Samples of all humans between 21–27 years represent the young phenotype. The samples of all humans between 67–75 years represent the aged phenotype.

