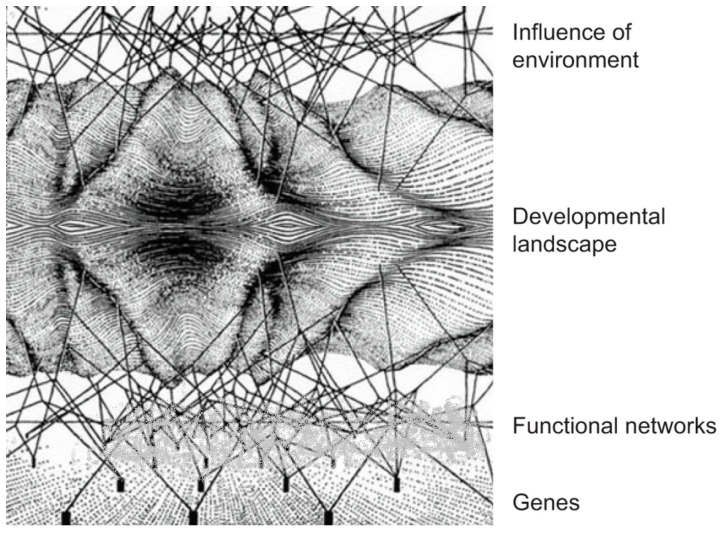
Figure 2.
Development of Waddington’s (1957) landscape diagram [43]. The original diagram was simply the lower half of this diagram, which Waddington used to indicate that the developmental phenotype (the landscape) is not directly dependent on the genes (the pegs at the bottom) but also depends on the regulatory networks represented as lying in between genes and the phenotype. Our version of the diagram incorporates two new features. First, organisms are open systems sensitive to the environment. This is represented by the top half of the diagram. Second, the regulatory networks in the lower half (the original half) of the diagram act to buffer genetic variation. This is represented by a ‘cloud’ covering a large fraction of the genome, corresponding to the fact that many mutations at the genome level are silent functionally. The regulatory networks can buffer many variations at the genome level. The filtering action of the ‘cloud’ performs a function similar to that of the ‘hold’ mechanism in this article. Differential mutation rates are not therefore essential to enable organisms to guide their own evolution.

