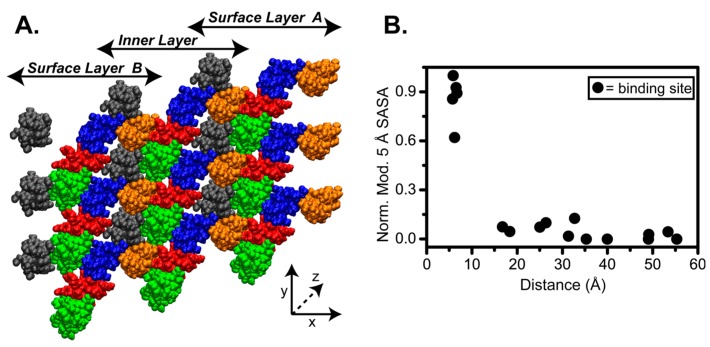
Figure 2.
(A) A representative cross-section showing the 3 × 3 SRU matrix used in the solvent accessible surface area (SASA) calculations. The model contains three SRUs in each the x- and y-dimensions, and the z-dimension extends to one D-period in length. Triple helical monomers are color-coded by D-segments as in Figure 1. Double-headed arrows indicate the three distinct layers in the x-dimension. (B) Correlation of SASA with binding site distance. The modified 5 Å SASA of 17 known binding sites with respect to the orientation proposed by Orgel et al. (“surface A”) is plotted vs. distance of the site from the surface.

