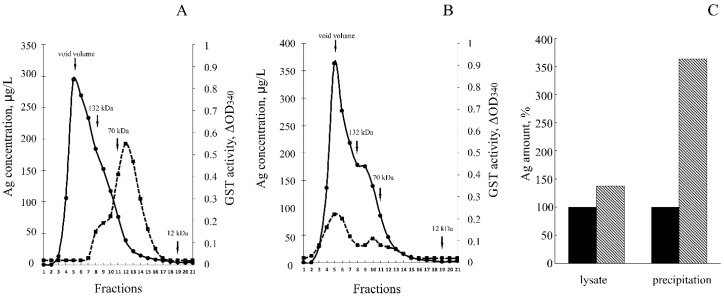
Figure 4.
Distribution of silver and GST enzymatic activity in cytoplasm of E. coli cells synthetizing GST (A) and GST-hNdCTR1 (B). Solid line: silver concentration; dotted line: GST enzymatic activity. The details of chromatographic analysis are described in Methods (Section 2.6). The arrows show elution rate of marker proteins: 132 kDa—human ceruloplasmin, 70 kDa—bovine serum albumin, 12 kDa—horse cytochrome C. (С) Amount of silver precipitated by antibodies to CTR1. Dark bar: E. coli BL21(DE3)/pGEX-4T-1; shaded bar: E. coli BL21(DE3)/pNdCTR1.

