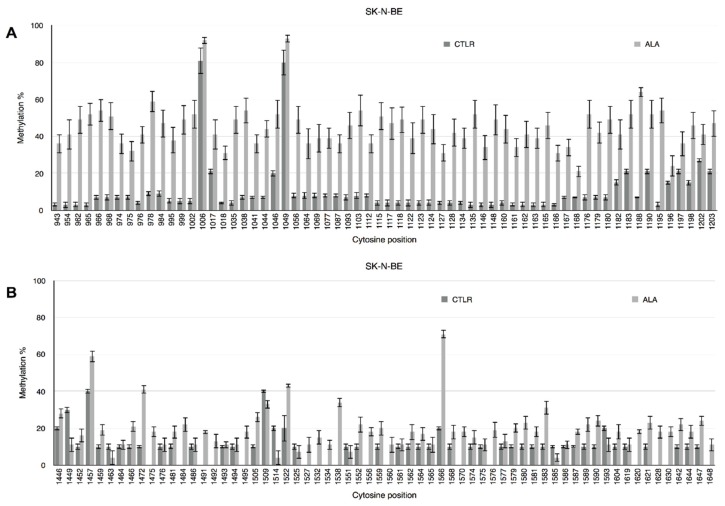
Figure 1.
Methylation pattern of IL-1β and IL-6 5′-flanking regions. CpG and non-CpG site-specific methylation pattern expressed as percent methylation for each cytosine in the investigated region of the human IL-1β (A) and IL-6 (B) promoters. Cytosine position in the reference sequence is indicated below the x-axis. Dark grey columns represent control cells, light grey columns represent alpha-lipoic acid (ALA)-treated cells.

