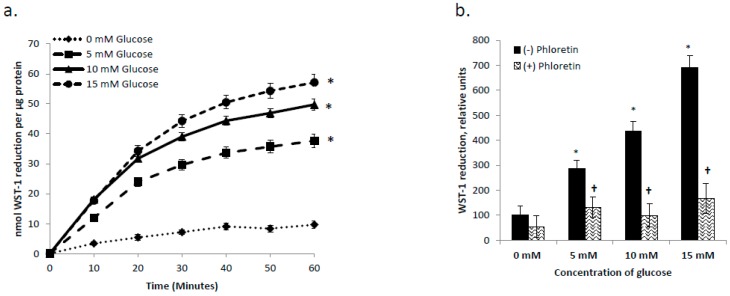
Figure 4.
tPMET is a glucose-dependent process. (a) tPMET increased by C2C12 myotubes as glucose concentration increased. N = 18/group, * p < 0.05 versus 0 mM glucose. (b) tPMET increases as glucose concentration increases and is suppressed in the presence of phloretin. N = 7/group, * p < 0.05 versus 0 mM glucose. † p < 0.05 versus (−) inhibitor at that concentration.

