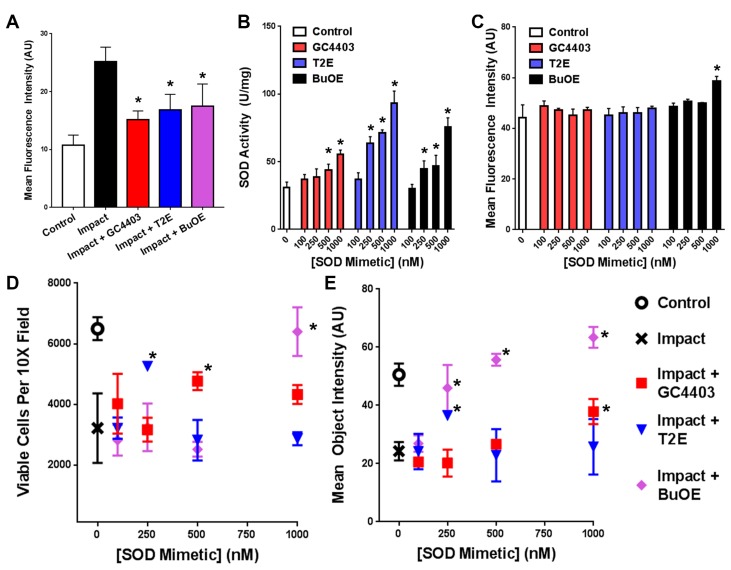
Figure 2.
GC4403, T2E, and BuOE provide dose-dependent protection of chondrocytes 24 h after 2 J impacts. (A) Previously described [21] increases in DHE staining of chondrocytes within 10× objective confocal images of impacted sites were reproduced and this increase was blunted with treatment by all three mimetics (n = 3). (B) SOD activity in unloaded primary chondrocytes shows a dose responsive increase with all three SOD mimetics (n = 3). (C) Mitochondrial staining with MitoTracker Deep Red following mimetic treatments in the absence of loading shows minimal changes in mitochondrial staining with the exception of the 1000 nM dose of BuOE, though many other mimetic treated samples insignificantly trended towards stronger staining than control (n = 3). (D) Cell counts of Calcein Green AM positive cells from 10× objective confocal images of sites within the impact zone (n = 3) show maximal protection by GC4403 between 500 nM and 1000 nM, protection by T2E at 250 nM, and protection by BuOE at 1000 nM. (E) Mean intensities of MitoTracker Deep Red from cells in (A) show maximal benefit from GC4403 at 1000 nM, protection by T2E at 250 nM, and protection by BuOE peaking at 1000 nM (n = 3). * indicate p < 0.01 compared to impact tissue without treatment and include both the T2E and BuOE treatments at 250 nM in panel C.

