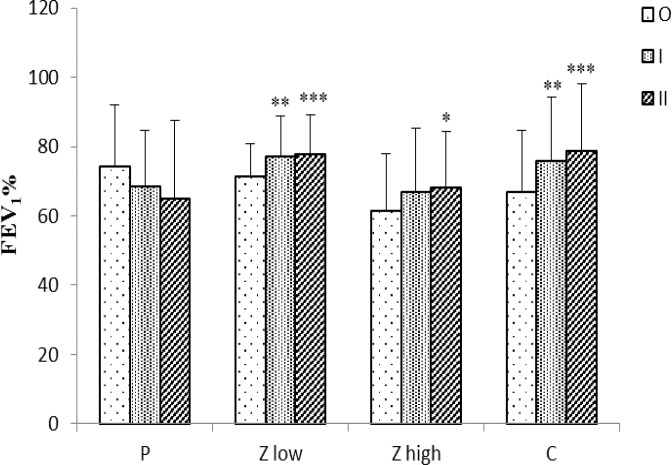
Figure 3.
FEV1% for placebo and treated groups (n =10) at three time points (O, I, and II).
The results are presented as mean ± SD. Statistical comparisons were performed using Repeated Measures procedure, with time as within-subjects. Bonferroni test was performed for pairwise comparisons.
* p<0.05, ** p<0.01, and *** p<0.001, show significant differences in data obtained at time I and II from that of time O, respectively.
P: Placebo group; Z low group were treated with 5 mg/kg/day of the extract; Z high group were treated with 10 mg/kg/day of the extract; C group were treated with 1.2 mg/kg/day carvacrol.

