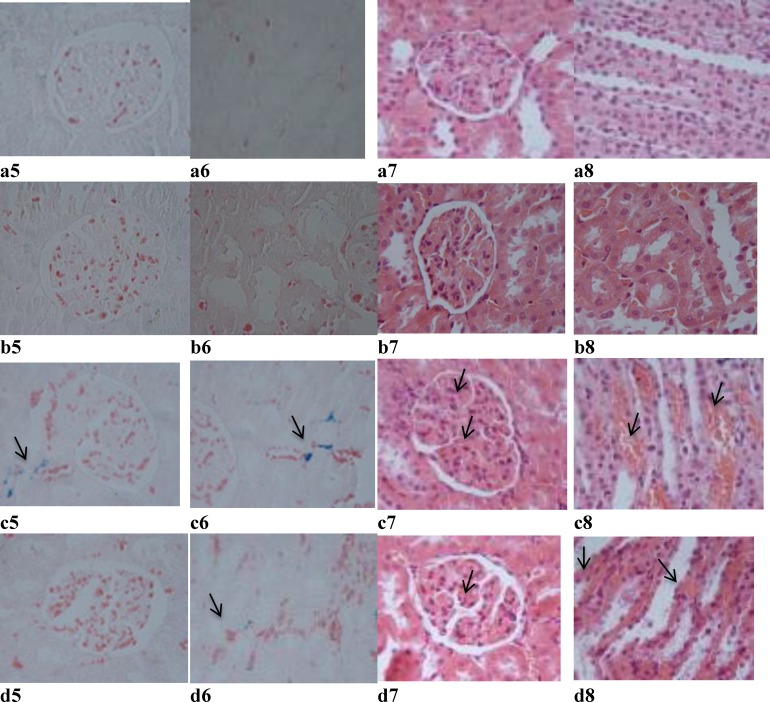
Figure 5.
Representative light microphotographs of the kidneys obtained from Sham (a5, a6, a7, and a8), Sham + G.E (b5, b6, b7, and b8), FS (c5, c6, c7, and c8), and FS + G.E group (d5, d6, d7, and d8). (Prussian blue staining in a5, b5, c5 and d5 shows iron particles in cytoplasm of cortical tubular cells and in a6, b6, c6 and d6 shows iron particles in cytoplasm of medullary tubular cells. Hematoxylin–eosin staining in a7, b7, c7, and d7 shows glomerular capillary congestion and in a8, b8, c8, and d8 shows medullary vascular congestion

