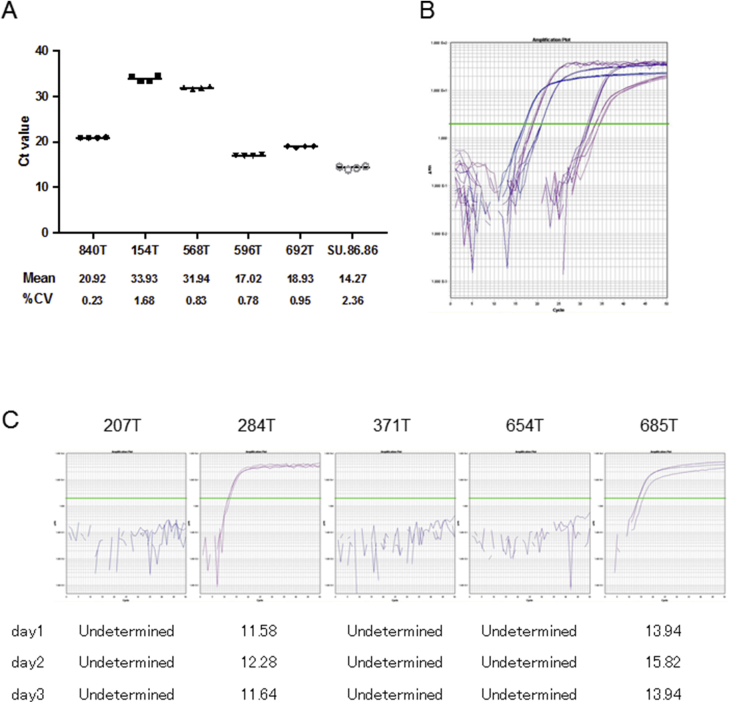
Supplemental Figure S10.
Intra and interassay variation of telomere fusion assay. A: Ct values of four technical replicates measured by nested real-time quantitative PCR (qPCR) in the same assay, using five representative intraductal papillary mucinous neoplasm (IPMN) DNA samples and the SU.86.86 cell line. B: Amplification curves of five DNA samples corresponding to A. C: Interassay variation using five representative fusion-positive or fusion-negative DNA samples. Green lines indicate the Ct value (B and C). Green bars indicate mean values. CV; coefficient of variation.

