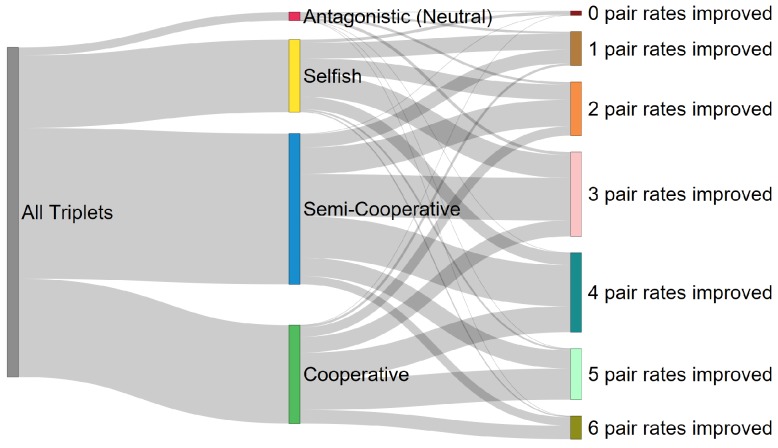
Figure 3.
Taxonomy of molecular cooperation using the empirically derived rate constants. The left bar (gray) represents all possible 560 triplet genotype combinations. The bars in the center correspond to the first-level classifications, and the height of the bar indicates which fraction of all triplets fell into that category. The bars on the right show the second level classifications and the fraction of all triplets which fall into that category.

