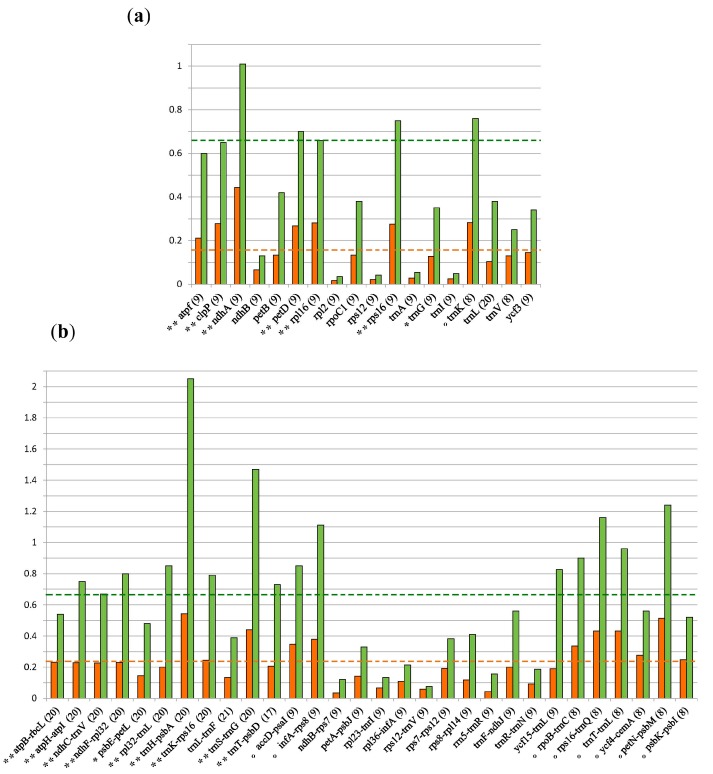
Figure 2.
Survey of nucleotide variation of non-coding regions. Histograms showing the normalized ratio expressed as percentage, in orange, and the average uncorrected p-distance, expressed as percentage, in green. The number of Ilex species used is indicated between brackets. * Marks a region selected as in Figure S2; ** mark regions validated with current sampling; ° mark regions selected solely under current sampling. (a) Values estimated from 18 single-loci intron alignments; (b) Values estimated from 30 single-loci IGS alignments.

