
Fig. 1.
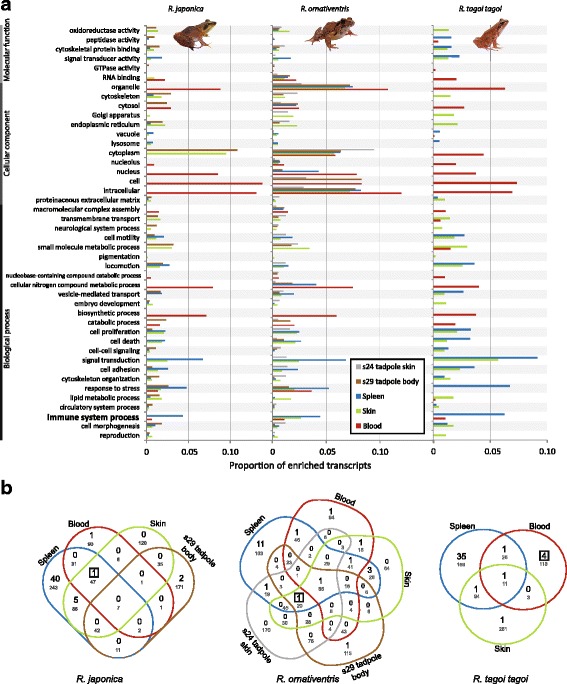
Transcriptome data was utilized to identify differentially expressed gene ontology (GO) categories between tissue types and life stages. a Summary of all enriched transcripts (proportion > 0.01) distributed into level two GO categories, run independently in each of the three focal frog species. Only GO categories enriched in a specific adult tissue (blood, skin, spleen) across all three species, or enriched in tadpoles compared to adult tissues in both R. japonica and R. ornativentris, are presented (full details in Additional file 1: Table S2). b Venn diagrams of full GO term enriched groups in blood, skin, blood (and tadpole) from the three species. Number of immune-related enriched GO terms are in black (summarized in Additional file 1: Tables S3 - S5), while total number of enriched GO terms belonging to the ‘biological process’ parent category are in grey. Position of term GO:0019886 (antigen processing and presentation of exogenous peptide antigen via MHC class II) is indicated by boxed number. Photo source: Q. Lau