
Fig. 4.
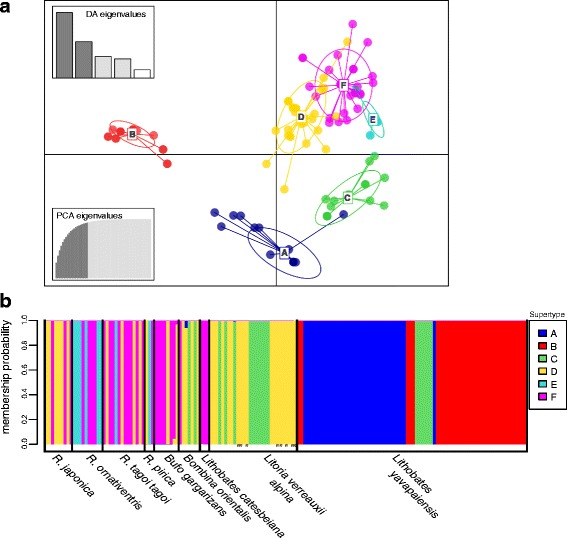
a Supertype scatterplot of MHC-IIB alleles or variants (dots) from the three Japanese Rana species and other species studied allocated to one of six supertypes (ellipses, ST-A to ST-F); the bottom-left graph represents the cumulative variance retained by 20 principal components, and the top-left graph represents eigenvalues retained for the discriminant analysis. b The membership probability of each allele or variant from the nine species used to allocate supertypes (alleles from L. verreauxii alpina considered associated with Bd resistance by Bataille et al. [18] are indicated by ‘R’)