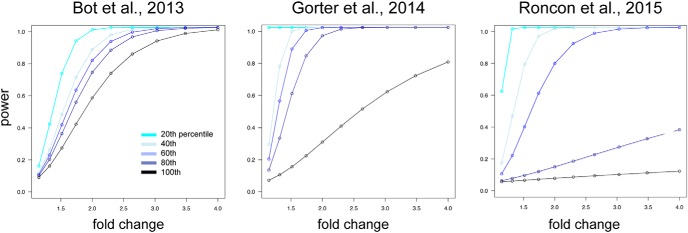
Figure 1.
Power calculation. Power calculation is plotted as the power (y-axis) to detect a miRNA with fold change (x-axis) according to the percentile of the ranked SDs for miRNAs for each study. Across all three models, the power to detect miRNA with fold change 2 or less falls below 80% for at least 40% of the miRNAs.

