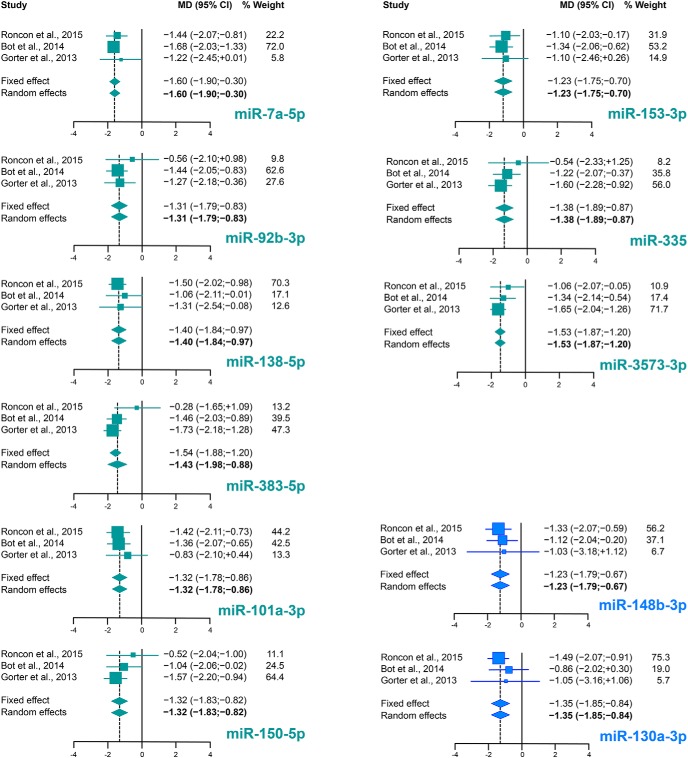
Figure 3.
Forest plots of selected miRNA. Forest plots for miR-7a-5p, miR-92b-3p, miR-101a-3p, miR-138-5p, miR-150-3p, miR-153-3p, miR-335, miR-383-3p, and miR-3573-3p are shown for the phase of epileptogenesis, and miR-130a-3p and miR-148b-3p for the chronic stage. For each miRNA, the effect size of the individual studies is reported as MD and 95% CI. The % weight refers to random effects analysis. Individual effect sizes are represented by colored boxes (green for epileptogenesis and blue for the chronic period) and 95% CI are denoted by black lines. The combined effect sizes are represented by diamonds, where diamond width correspond to the 95% CI bounds; boxes and diamonds size is proportional to effect size estimation precision. For each miRNA, the weight of the dataset in the combined analysis has been reported in percentage.

