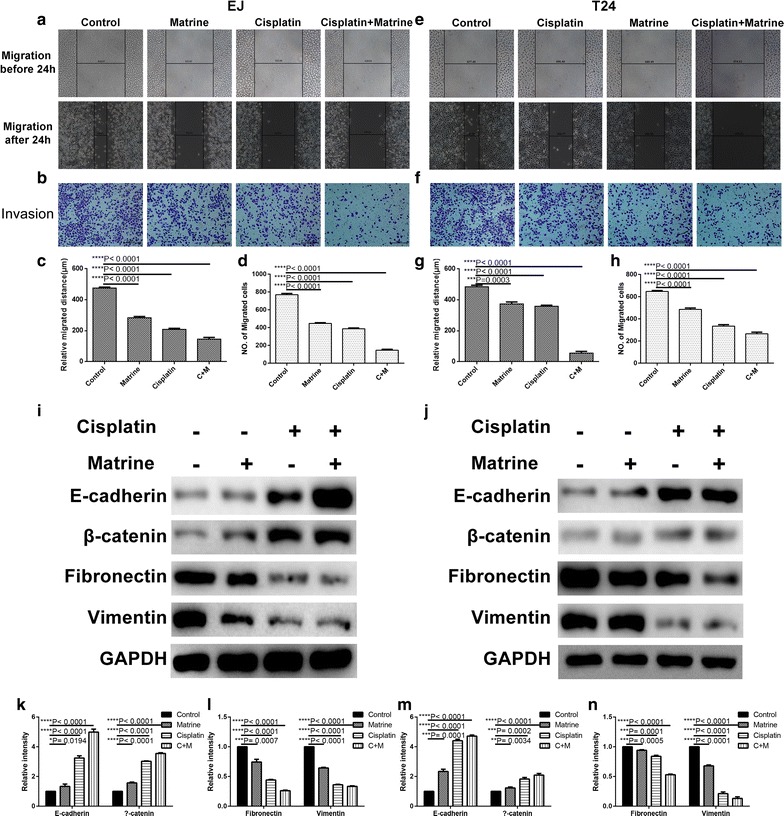
Fig. 3.

Matrine and cisplatin suppressed migration and invasion ability of EJ and T24 cells. Typical images of wound healing (a, e) and transwell assay (b, f) after 24 h treatment with 5 mM of matrine, 4 μM of cisplatin alone and 1 μM of cisplatin and 2 mM of matrine in combination. Histograms show the average migrated distance (c, g) and the amount of invasive cells (d, h), respectively. The protein expression levels of E-cadherin, β-catenin, Fibronectin, Vimentin and GAPDH of EJ and T24 cells after 24 h treatment with 4 μM of cisplatin, 5 mM of matrine and 1 μM of cisplatin and 2 mM of matrine in combination (i, j). Histograms present the relative grey value of the related proteins measured by ImageJ (k, l, m, n). All data are shown as the mean ± SD of three independent experiments. *P < 0.05, **P < 0.01, ***P < 0.001, or ****P < 0.0001 versus the control group (magnification, ×100; scale bars, 100 μm)
