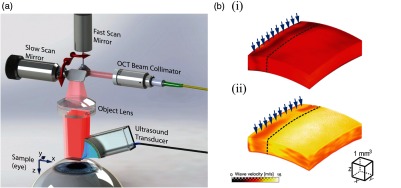
Fig. 24.
(a) Schematic demonstrating noncontact system using to analyze corneal biomechanics. (b) 3-D renderings of group velocity within the cornea demonstrate different elasticity at different IOP—top 10 mm Hg and bottom 40 mm Hg. (Figure reproduced from Ref. 58.)

