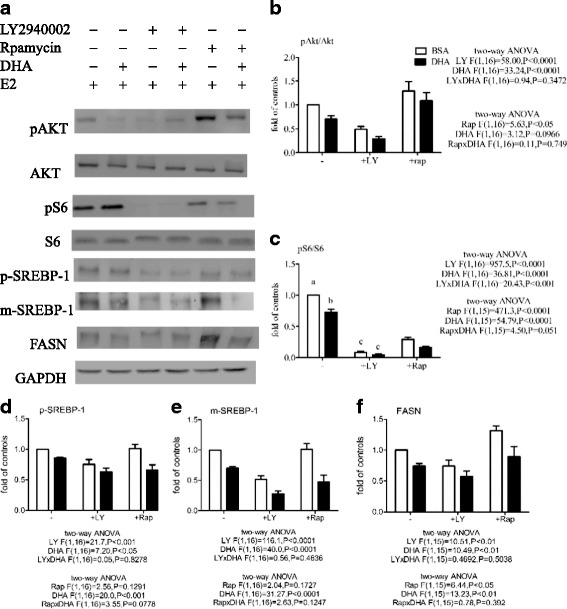
Fig. 5.

Effect of inhibitors and DHA on the E2-stimulated increase in the pAkt/Akt and pS6/S6 ratios and p-SREBP-1, m-SREBP-1, and FASN expression in MCF-7 cells. Cells were pretreated with BSA or 60 μM BSA-bound DHA for 48 h in DMEM containing 5% CD-FBS, then the same medium alone, 20 μM LY294002 (LY), or 0.5 nM rapamycin (Rap) was added for 1 h, followed by stimulation with 10 nM E2, then Western blot analysis was used to measure the pAkt/Akt and pS6/S6 ratios after 1 h of incubation and p-SREBP-1, m-SREBP-1, and FASN expression after 24 h (a). Total Akt or total S6 was used as the loading control for pAkt (b) or pS6 (c), respectively, while GAPDH was used as the loading control for p-SREBP-1 (d), m-SREBP-1 (e), and FASN (f).The levels are expressed as a fold value compared to control BSA-treated cells. Two-way ANOVA followed by the Bonferroni posttest was used to compare DHA and inhibitor effects. The data are presented as the mean ± S.E.M for 4–5 independent experiments
