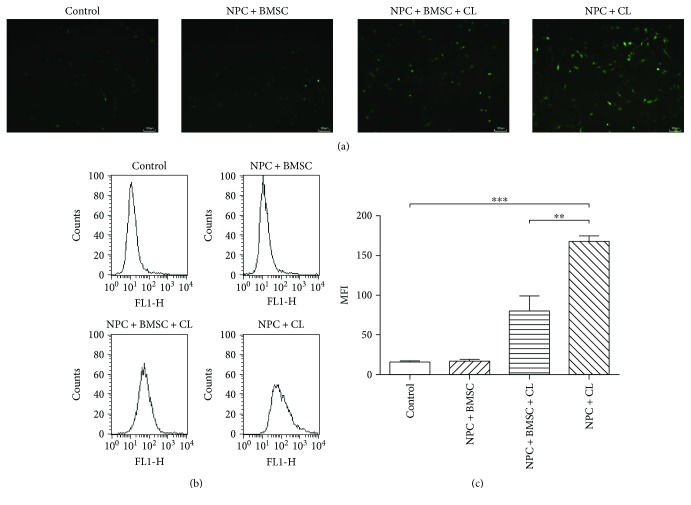
Figure 3.
The effect of BMSCs on the compression-induced intracellular accumulation of ROS in NPCs. (a) Typical graphs of ROS imaged by fluorescence microscopy. (b) The intracellular ROS levels were measured by flow cytometry through DCFH-DA staining. (c) Summary data showing the mean fluorescence intensity (MFI) in different groups. CL means compression load. The data are expressed as mean ± SD from three independent experiments (∗∗P < 0.01 and ∗∗∗P < 0.001 versus control or NPC + BMSC + CL).

