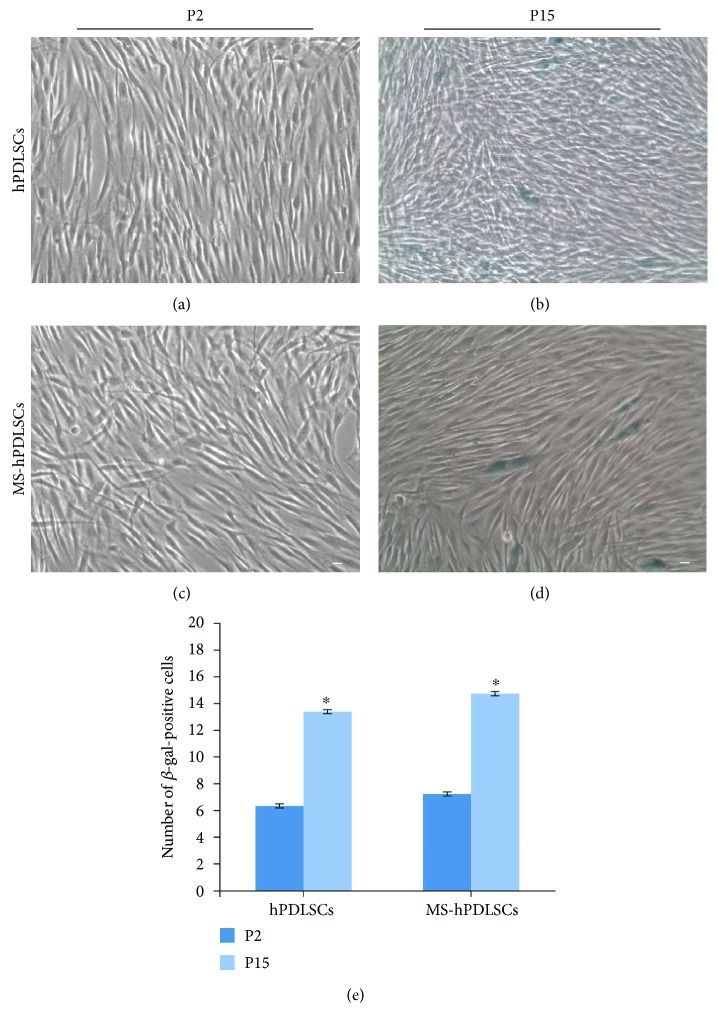
Figure 7.
Cellular senescence assessment. hPDLSCs (a) and MS-hPDLSCs (c) at P2 showed a basal staining for X-gal blue solution, while significant positive staining was observed in hPDLSCs (b) and MS-hPDLSCs (d) at P15. Mag:10x. Bar: 10 μm. Histogram shows number of X-gal blue-positive hPDLSCs and MS-hPDLSCs at P2 and P15 (e).∗p < 0.05. Data are expressed as mean ± SEM.

