
Fig. 1.
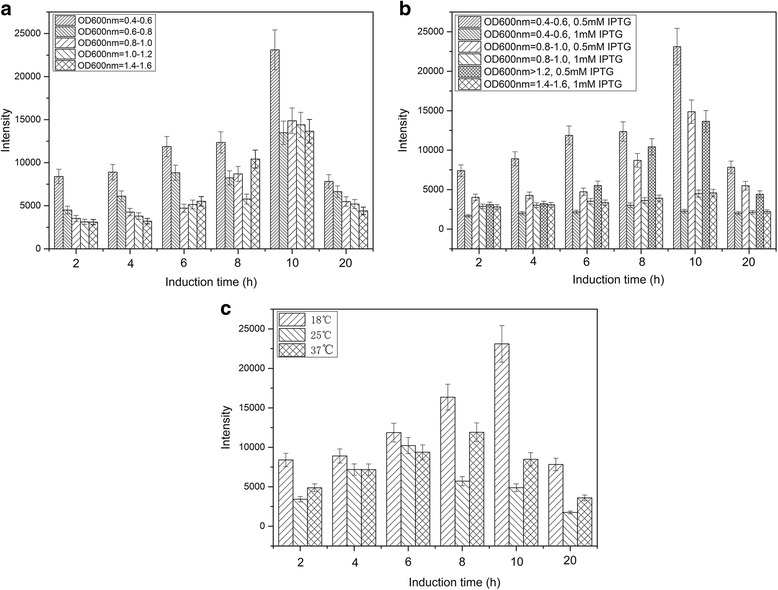
Optimization of induction phase, inducer concentration and induction temerature. Production of CCL8 was characterized using dot-blot. The intensities of dot-blot were averaged and error bars were calculated based on three times experiments. a Effect of induction phase on the expression of pET28a-CCL8. b Effect of inducer concentration on the expression of pET28a-CCL8. c Effect of expression temperature on the expression of pET28a-CCL8