
Fig. 3.
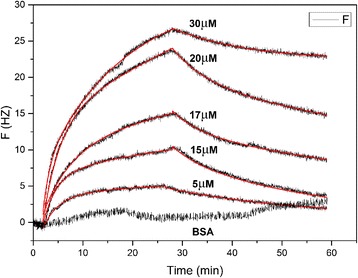
QCM sensorgrams for binding of different concentrations of CCL8 with CCR3. The experimental curves are shown in black, while the fitted curves are in red. The sensorgrams were fitted globally with a 1:1 binding model [22]
Official websites use .gov
A
.gov website belongs to an official
government organization in the United States.
Secure .gov websites use HTTPS
A lock (
) or https:// means you've safely
connected to the .gov website. Share sensitive
information only on official, secure websites.
QCM sensorgrams for binding of different concentrations of CCL8 with CCR3. The experimental curves are shown in black, while the fitted curves are in red. The sensorgrams were fitted globally with a 1:1 binding model [22]